CREATE AND TRADE OF GREENHOUSE GASES
The big problem with a proposed Cap and Trade program for greenhouse gas emissions is that one must know in advance how much it will cost to make the required reductions. The cap is set with an assumption of the cost to stay under that cap. The polarizing factor in the current debate is based on vastly different assumptions of the costs of reductions at various points in time.
A concept called “Create and Trade” navigates around this problem and in fact should appeal to all sides. For those who believe the cost will be low, then this will be a route for very quick results. For those who believe the cost will be high, this will be a route to prevent costly mistakes.
“Create and Trade” is a destination based program. The true destination is maximum greenhouse gas reduction at a point in time at a tolerable increase in power cost. So we start by determining how much more the public would be willing to pay for a certain level of reduction at a certain point in time. For example, let’s assume that the public is willing to pay $50/yr increase in electric costs per household x 100 million households for major reductions but only $10/yr for minor reductions over the next 10 years. Thus a potential fund of $5 billion per year is available to make major reductions but only $1 billion/yr for minor reductions.
Utilities that make reductions would be paid based on a combination of unit and percent reductions. Each utility would make contributions based on its percentage of national CO2 emissions.
The rewards for early and higher reductions could be very substantial if it turns out that the cost of reduction is low. On the other hand if the cost of CO2 reduction turns out to be high then the pioneer would end up a net loser.
Here is why this should appeal to both extremes. The environmentalists who believe that the cost of reductions will be low can join investors and spur the early adoption of many promising renewable technologies. So under a low cost scenario this becomes a fast track way to achieve maximum CO2 reduction quickly.
The utilities should like the plan because they are not at risk. Since their rate payers have already agreed to an increase to cover the costs, the non-pioneering scenario is break even. If they become a pioneer then they risk losing or making money. They can also pass this risk along to third party project investors.
The rate payers also should be pleased. Their rates only go up if there are reductions achieved at reasonable cost. So they definitely will be paying for what they want, which is cost effective greenhouse gas reduction.
This is just the skeleton of a program. It is based on the same concept applied to mercury and proposed several years ago. This proposal received considerable scrutiny and was fine tuned to assure that the intended result could be obtained. You can see the details below
CREATE AND TRADE
(Destination Based Early Mercury Reduction Program)
Adoption of “Create and Trade” as a supplement to “cap and trade” would eliminate the confrontation and would result in the rapid adoption of cost effective mercury reduction. EPA has recognized the need for a supplemental program to insure that technologies are available and proven at the time of the cap reduction from 34 to 15 tons. “Create and Trade” would not only serve this function but would make “cap and trade” irrelevant. In fact if mercury reduction can be accomplished as cheaply as claimed by the environmentalists then mercury emissions would drop to 5-10 tons within a few years of implementation of “Create and Trade.”
The Center for Clean Air Policy has suggested that 10 percent of the allowances be made available each year to units installing advanced mercury control technology in the years 2006-9. There could be a reverse auction with the utilities bidding the fewest allowances per megawatt the winners. This would certainly encourage some use of activated carbon. In fact CCAP estimates there would be 10,000 MW of carbon injection in 2006 and as much as 30,000 MW in 2010, compared to 20,000 MW in 2010 without the incentive program.
In one sense “Create and Trade” is a refinement of the CCAP suggestion Under “Create and Trade” the number of allowances is actually created by the reducers and not pre-determined. It provides a substantial and predictable payment for the early reducer (extra allowances do not provide this certainty). It also creates a “deficit cap” for the non-reducer. So you have both the carrot and the stick. Those that make big early reductions are in effect paid by those who do not.
Utilities will like this plan because of the cost ceiling and the certainty. The plan is formally titled “Destination Based Early Mercury Reduction Program” because it insures travel to the true destination which is “cost effective mercury reduction” This destination by consensus of the rate payers is about 1-2% increase in electricity rates for 80-90% mercury removal. So utility risk is reduced to this amount.
The number of allowances and the deficit cap are all determined by the utilities initiating reductions. The early reducers generate allowances based on pounds removed multiplied by the percentage reduction. This sets a great incentive for highly efficient technologies.
An investment in an 80% reduction technology in 2007 could net payments equivalent to 5% or more of present rates for the implementing utility. Such an attractive potential return will more than justify the risk.
If other utilities do not adopt similarly cost effective technology the implementing utility will continue to enjoy this windfall. But the more likely scenario is quick adoption of this technology by the other utilities. At this point the payments to the early reducer are diminished or eliminated. Nevertheless the early reducer will have received substantial payment for an investment he would have eventually been forced to make anyway.
Destination Based Program Requires Careful Selection of Vehicle, Route, and Speed and Precise Definition of the Destination
The program to reduce mercury can be likened to a trip. Decisions have to be made relative to the destination, the route, and the speed. There may be one vehicle such as an airplane to get to the destination and another such as a rental car to function once you are there.
The proposed cap-and-trade program is really just the rental car to allow you to function at the destination. The CCAP incentive program is a train ride to the first stop but still short of the destination. That vehicle is "Create and Trade". What we really need is an airplane to get us to the destination quickly.
Mercury Destination Based Trip Plan
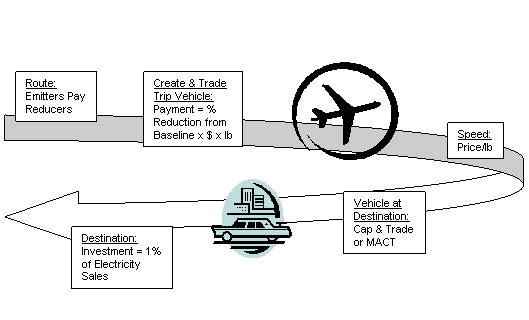
The destination is the consensus value. Specifically, this is how much of an increase in the individual electricity bill the citizen is willing to pay for various percentages of mercury removal. EPA needs to poll the public to determine this percentage. Response to date would indicate that this value is 1 to 3 percent for lots of reduction. There is not likely to be much support for an extra one percent increase in the bill just to get a few percent of additional mercury reduction.
The route is a specified payment to those who reduce emissions from those who do not. (This is as different from cap-and-trade as is the airplane to the rental car.) You still have cap-and-trade to help you function at the destination, but it is likely to be redundant.
The vehicle is a "Create and Trade" payment based on the percent reduction from a baseline which is the lowest number among 2003 emissions, allowances or average emissions of all plants.
The speed is determined by the size of that payment. Should this be $50,000, $100,000, or more?
Under the EPA proposal, mercury emissions will be capped and traded at 34 tons in 2010 and 15 tons in 2018. With the addition of the “Create and Trade”, plants which reduce mercury starting in 2007 would be paid a bonus (allowance payments) based on the quantity of mercury removed multiplied by the percent removal from a baseline. The cost would be shared by all utilities based on their percentage of total emissions (deficit cap)
An example of the system is as follows: The average 300 MW boiler emits 100 pounds of mercury per year. The proposed 2010 cap would give this plant 66 pounds of allowances. Assume that this plant would receive an allowance payment which is $100,000/lb x the percentage reduction from the baseline x number of pounds reduced.
2007 Incentive for 300 MW Plant
|
Example: |
A |
B |
|
Mercury emissions (lbs) in 2003 example plant |
101 |
101 |
|
Average mercury emissions all plants per 300 MW |
100 |
100 |
|
Emissions 2007 (lbs) |
34 |
6 |
|
Reduction from baseline (100 lbs in this case) |
66 |
94 |
|
Percent reduction from baseline |
66 |
94 |
|
Total Receipt ($1,000) |
4356 |
8836 |
The baseline is 100 pounds rather than 101 pounds. Since the average emissions for all plants is less than the example plant, the average emissions become the baseline. If this were a western utility with only 60 lbs/yr emission, it would have a 60 pound baseline.
Cost is Not a Tax, It is Research Funding
Utilities will be sharing the cost of the funds distributed to the early reducers (deficit cap). Isn’t this a tax? If so, why not just tax mercury emissions? The problem with a fixed tax is that it presupposes knowledge about costs. The funding under the "Create and Trade" program is not fixed. Unless some utilities reduce, there is no cost to the others.
The goal is to create a big financial incentive for reduction. As can be seen from the following graph, there is a big return for Utility B which invests in 94 percent mercury removal technology. Utility A with a 66 percent removal has a modest return and Utility C which does nothing pays substantially by 2010.
Payments
|
|
All Utilities |
Individual Utilities |
||||||||
|
|
|
|
|
|
|
|
|
Payment ($ Thousands) |
||
|
Year |
Percent Reduction |
Pounds Reduced |
Pounds Reduced from Baseline |
Reduction Percent Average |
Deficit Cap Payment |
Pounds Emissions |
Allowance Payment/ |
A |
B |
C |
|
|
|
|
|
|
|
|
|
34 lbs |
6 lbs |
100 lbs |
|
2007 |
10% |
9,600 |
9,600 |
40% |
384 |
86,400 |
4,444 |
151 |
27 |
444 |
|
2008 |
20% |
19,200 |
9,600 |
50% |
480 |
76,800 |
6,250 |
213 |
38 |
625 |
|
2009 |
30% |
28,800 |
9,600 |
60% |
576 |
67,200 |
8,571 |
291 |
51 |
857 |
|
2010 |
40% |
38,400 |
9,600 |
70% |
672 |
57,600 |
11,667 |
397 |
70 |
1167 |
A Receipts ($ Thousands)
|
Year |
Mercury Emissions Pounds |
Average Mercury Emissions All Plants |
Pound Reduction from Baseline |
Percent Reduction from Baseline |
Allowance Sale Price |
Receipt |
|
2007 |
34 |
100 |
66 |
66% |
66.0 |
4,356.0 |
|
2008 |
34 |
90 |
56 |
62% |
62.2 |
3,484.4 |
|
2009 |
34 |
80 |
46 |
58% |
57.5 |
2,645.0 |
|
2010 |
34 |
70 |
36 |
51% |
51.4 |
1,851.4 |
B Receipts ($ Thousands)
|
Year |
Mercury Emissions Pounds |
Average Mercury Emissions All Plants |
Pound Reduction from Baseline |
Percent Reduction from Baseline |
Allowance Sale Price |
Receipt |
|
2007 |
6 |
100 |
94 |
94% |
94.0 |
8,836.0 |
|
2008 |
6 |
90 |
84 |
93% |
93.3 |
7,840.0 |
|
2009 |
6 |
80 |
74 |
93% |
92.5 |
6,845.0 |
|
2010 |
6 |
70 |
64 |
91% |
91.4 |
5,851.4 |
C Receipts ($ Thousands)
|
Year |
Mercury Emissions Pounds |
Average Mercury Emissions All Plants |
Pound Reduction from Baseline |
Percent Reduction from Baseline |
Allowance Sale Price |
Receipt |
|
2007 |
100 |
100 |
0 |
0% |
- |
- |
|
2008 |
100 |
90 |
0 |
0% |
- |
- |
|
2009 |
100 |
80 |
0 |
0% |
- |
- |
|
2010 |
100 |
70 |
0 |
0% |
- |
- |
Net Gain/Loss ($ Thousands)
|
|
A |
B |
C |
|
2007 Receipts |
4,356 |
8,836 |
- |
|
2007 Payments |
151 |
27 |
444 |
|
Net |
4,205 |
8,809 |
(444) |
|
2008 Receipts |
3,484 |
7,840 |
- |
|
2008 Payments |
213 |
38 |
625 |
|
Net |
3,272 |
7,803 |
(625) |
|
2009 Receipts |
2,645 |
6,845 |
- |
|
2009 Payments |
291 |
51 |
857 |
|
Net |
2,354 |
6,794 |
(857) |
|
2010 Receipts |
1,851 |
5,851 |
- |
|
2010 Payments |
397 |
70 |
1,167 |
|
Net |
1,455 |
5,781 |
(1,167) |
|
4 Year Total Net |
11,285 |
29,187 |
(3,093) |
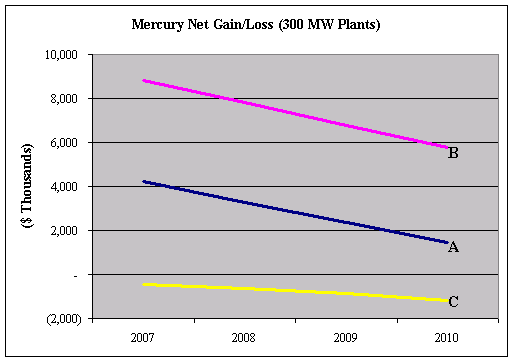
The amount of the payment depends on the percentage removed individually. So in 2007 in this example 10 percent of the mercury is reduced but it is accomplished through projects with 40 percent efficiency. All emitters share the payment based on their percentage of the total emissions. A utility which does nothing pays an increasing share of an increasing payment.
There is a 4 year net differential of $32 million between Utility B and Utility C in the 2007-10 time frame. This is a benefit of $108/kW in just four years. If other utilities are slow to make major reductions in 2010 and beyond then, the revenues would be even higher.
If the utility is successful in removing 94 percent of the mercury at less than one percent of its rates, and is getting paid the equivalent of five percent of its rates, and avoiding costs equal to another one percent for a few years, there would be enough potential profit to bring in unlimited third party investors.
Other utilities will also invest if, in fact, mercury can be removed cost effectively. So the most likely scenario is that the huge windfall would last for only one or two years. Eventually all utilities would be using cost-effective technology and no receipts would be forthcoming.
The worst case scenario for the investing utility is that all utilities soon adopt the technology and payments cease. But the decision to invest is still equally attractive because of the avoided cost of not investing. The third party financier will have to be paid on the basis of revenues plus avoided costs.
With this destination-based approach there would be a huge investment in a variety of technologies. The return is large enough to warrant installation of chloride pre-scrubbers even without additional pilot work. It is high enough to replace existing catalyst with a mercury oxidation catalyst. It is high enough to justify the switch to a fabric filter (with carbon injection) rather than a precipitator upgrade.
Enormous Incentive for Technology Providers
This system would work in tandem with the cap-and-trade system. But, if the true cost of mercury reduction is close to the consensus value, then the cap and trade system will be redundant. There will be many more allowances generated than are needed, so the allowances will be worthless. The cap-and-trade system then is a fall back tool in case the costs of mercury reduction are very high, and plants must be forced into technology investments.
This "Create and Trade" plan would provide enormous incentive for technology providers. It would also be of great interest to investors. It would therefore allow utilities to transfer the risks to third parties. The plan should appeal to all parties involved. In fact, it should appeal most to both extremes. Environmentalists, who believe the cost of mercury reduction will be very small, will see this as a way to get complete reduction quickly. Utilities, who believe the cost will be exorbitant, will see this as a way to make cap-and-trade more palatable without causing any additional investment. The majority will see this as what it is: simply a way to efficiently reach the consensus value destination.
![]()